 Projects
Tools I’ve built for my classes, my colleagues, my friends, and myself.
Choose any one for a full list of features and more screenshots.
All names and data shown in the screenshots are fictional.
CLASSROOM & GRADING
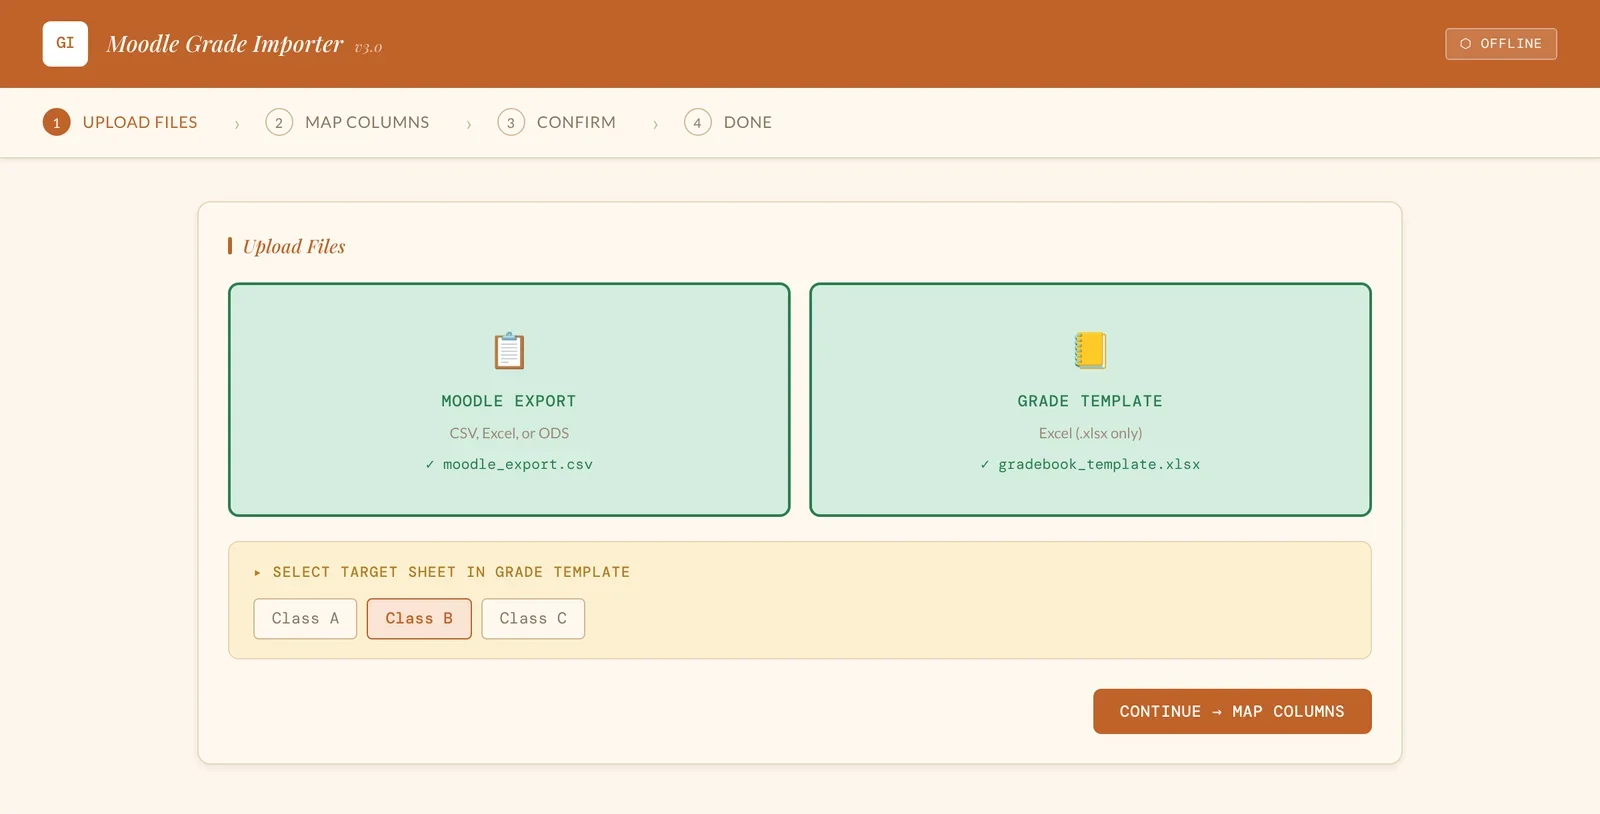
Moodle Grade Importer
The teacher drops in a Moodle grade export and their own Excel gradebook. The tool matches students by ID and columns by name, shows its proposed matches for a quick review, then writes the scores straight into the gradebook without disturbing its formatting or formulas.
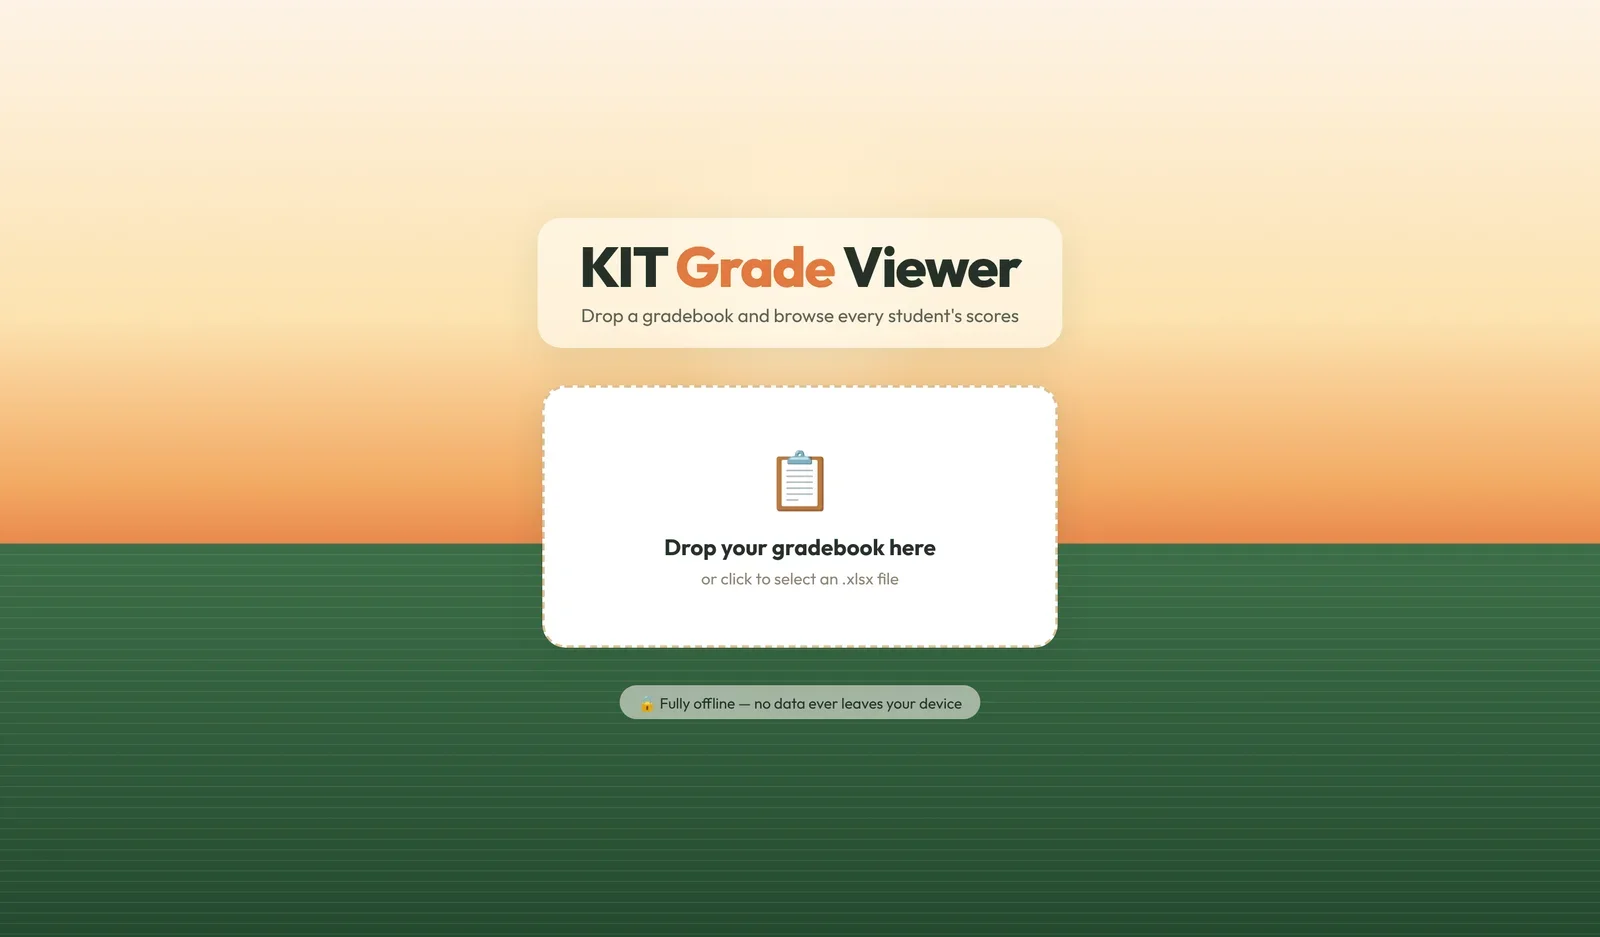
Grade Viewer
The teacher opens an Excel gradebook in the browser and picks a class. During one-on-one conferences, it shows one student at a time, with every score, attendance, and the current grade on a single screen.
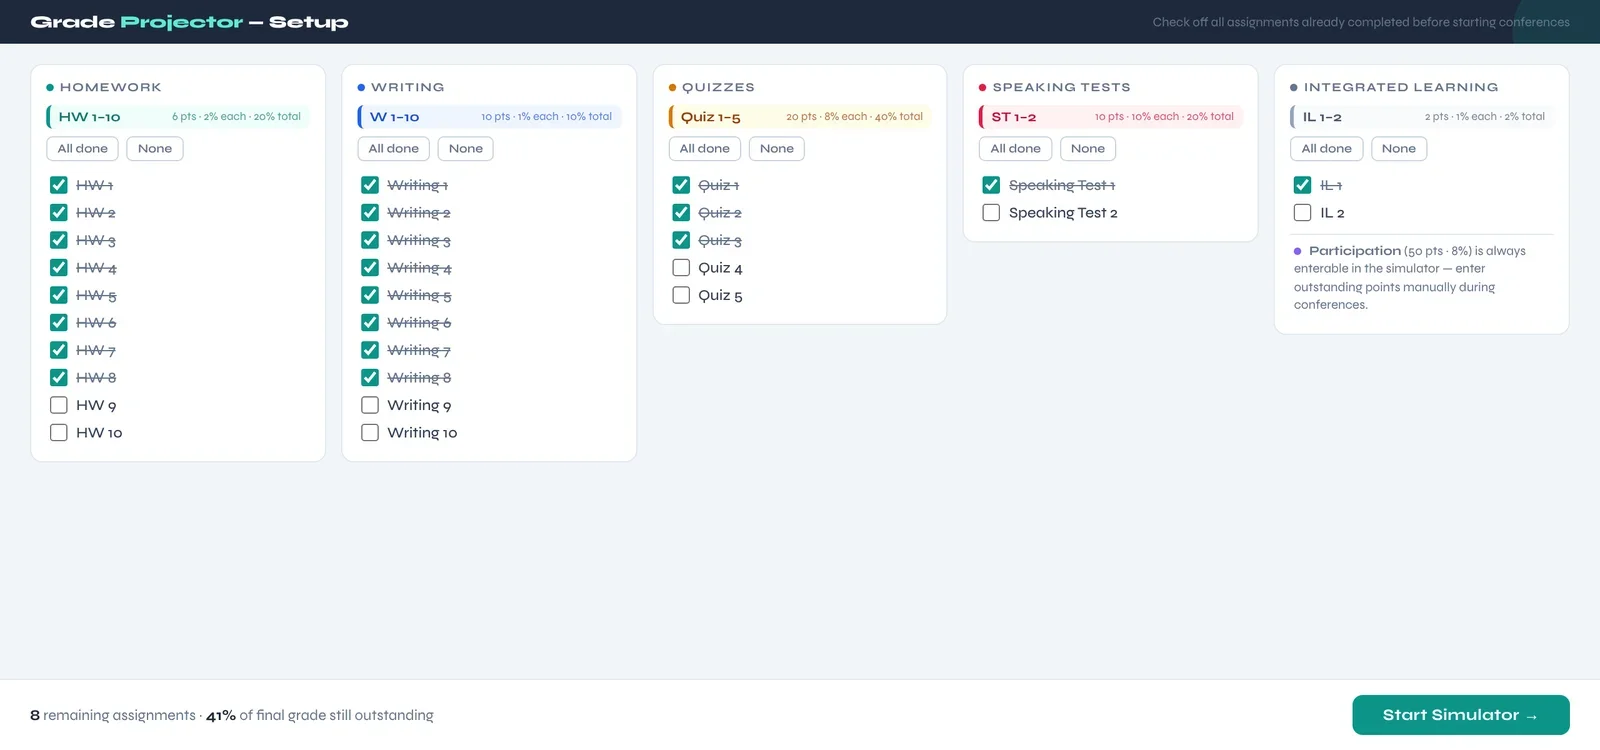
Grade Projector
Before conferences, the teacher checks off the assignments that have already been graded. During each conference, they enter the student's current score and try out scores on the remaining work to show the final grade each scenario would produce.
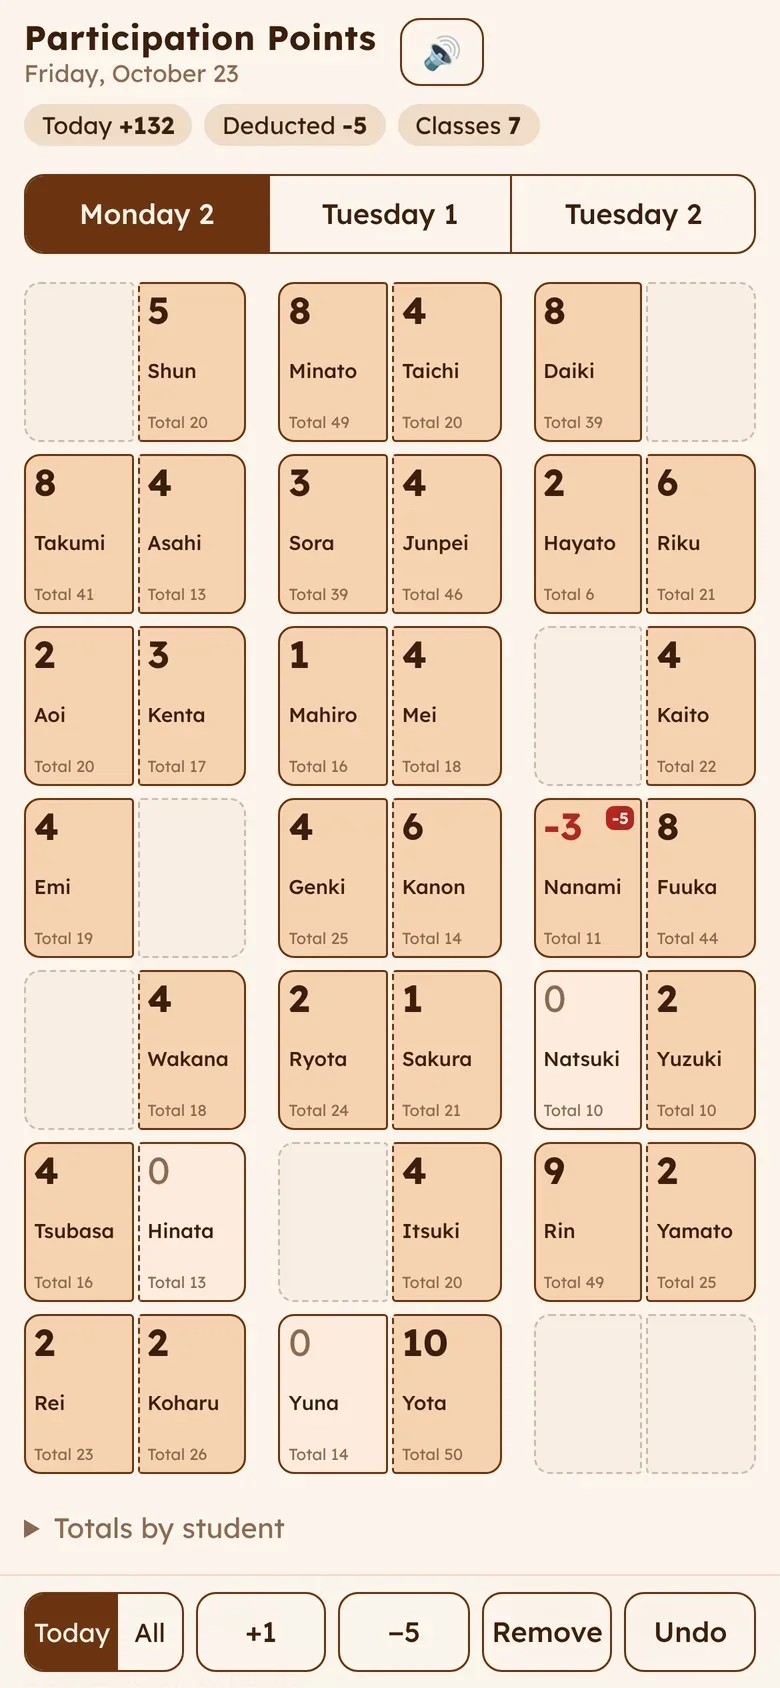
Participation Points
The teacher opens it on a phone during class and taps a student's desk on the seating chart whenever they ask or answer a question. Points are saved by date and synced across devices, so running totals and a log of deductions are ready at the end of the term.
TEAM & FRIENDS
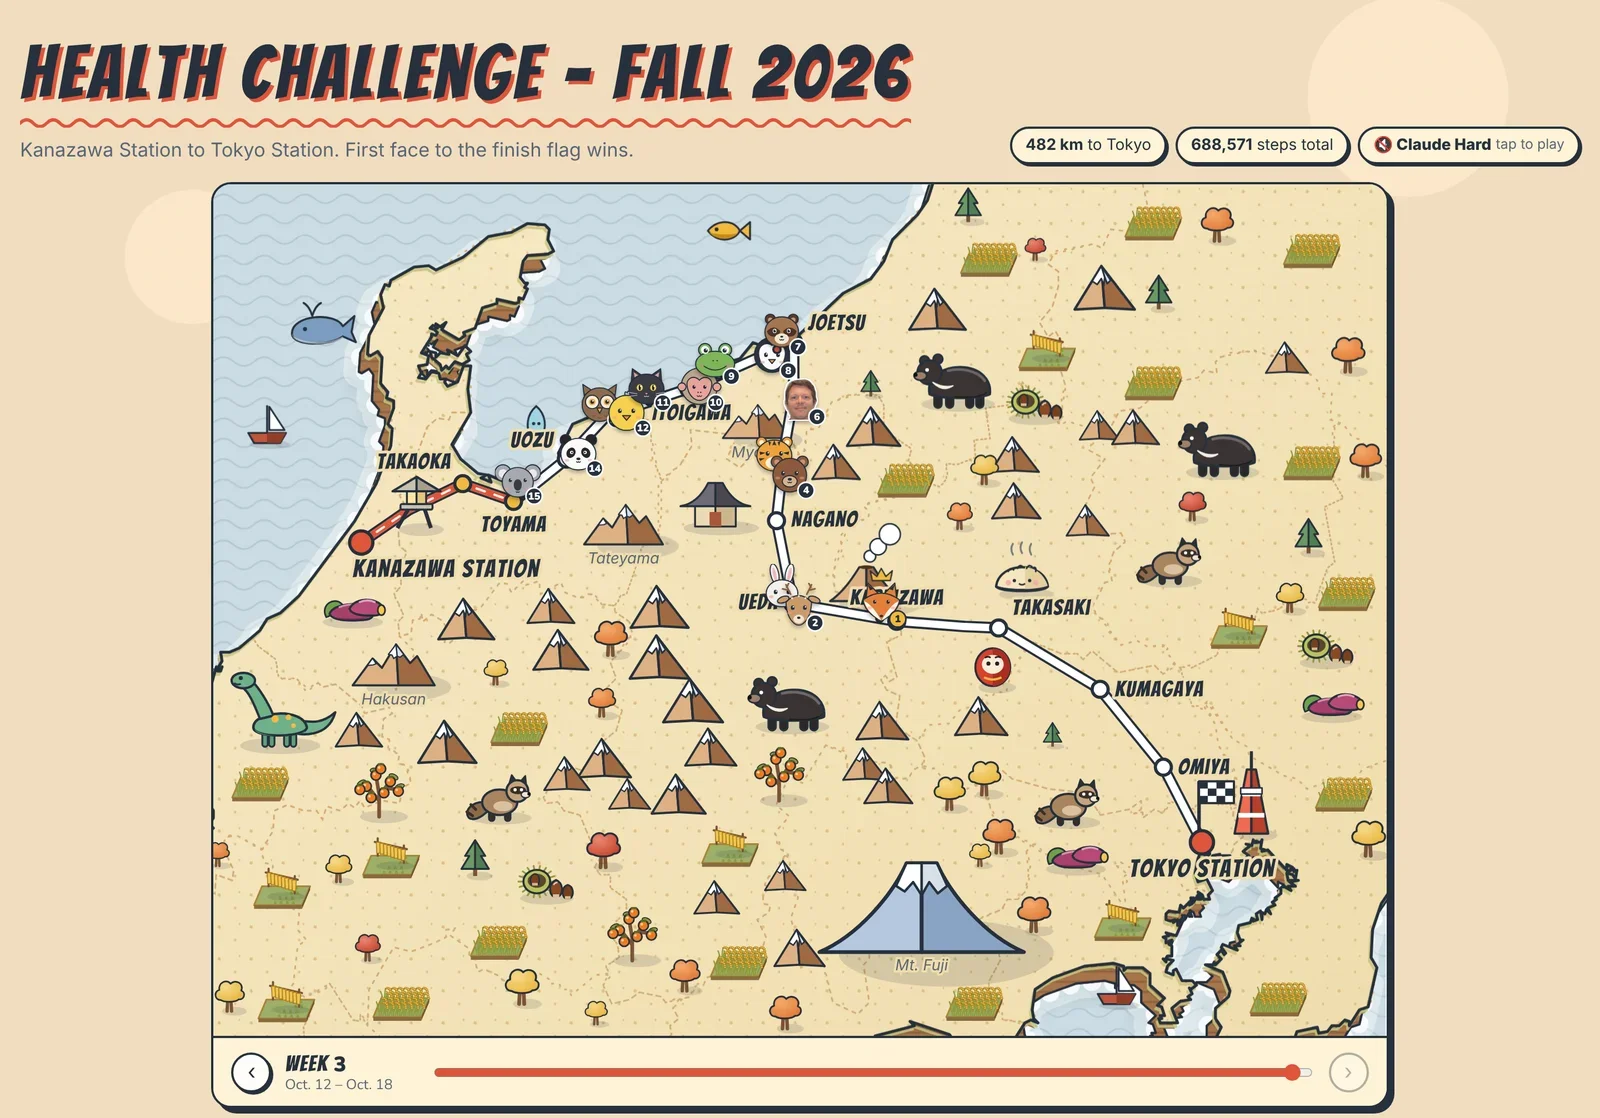
Health Challenge Tracker
Participants record their weekly step totals in a shared Excel log, and the tracker imports it and converts steps to distance. Each walker moves along the 482 km (300 mi) route from Kanazawa Station to Tokyo Station on an illustrated map. Every week brings new standings, a race report, and a chart of how places changed.
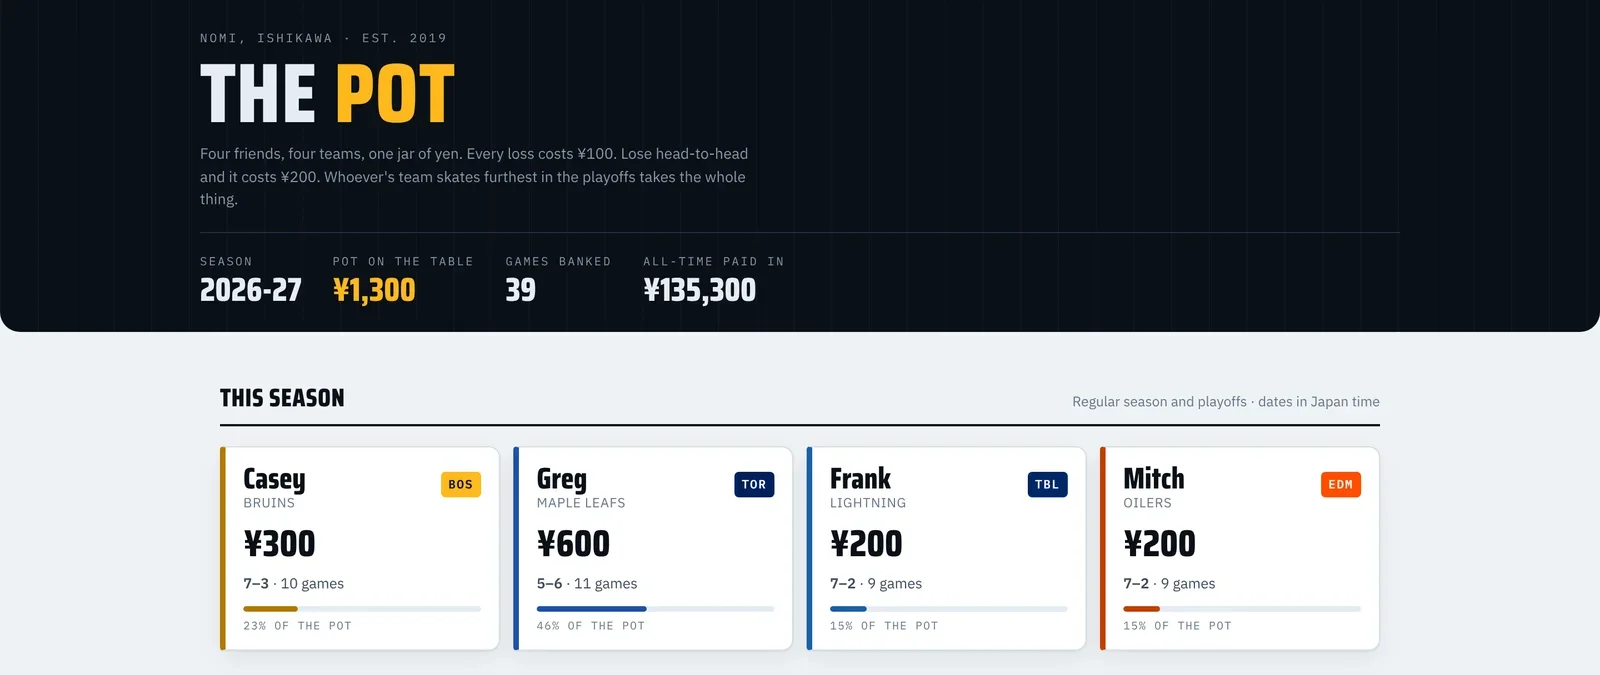
The Pot
Each member owns one NHL team, and every loss by that team costs them money in the pot. Results are pulled from the NHL once a day to update the ledger, and a weekly commissioner's report recaps the action. Whoever's team goes furthest in the playoffs takes the whole pot.
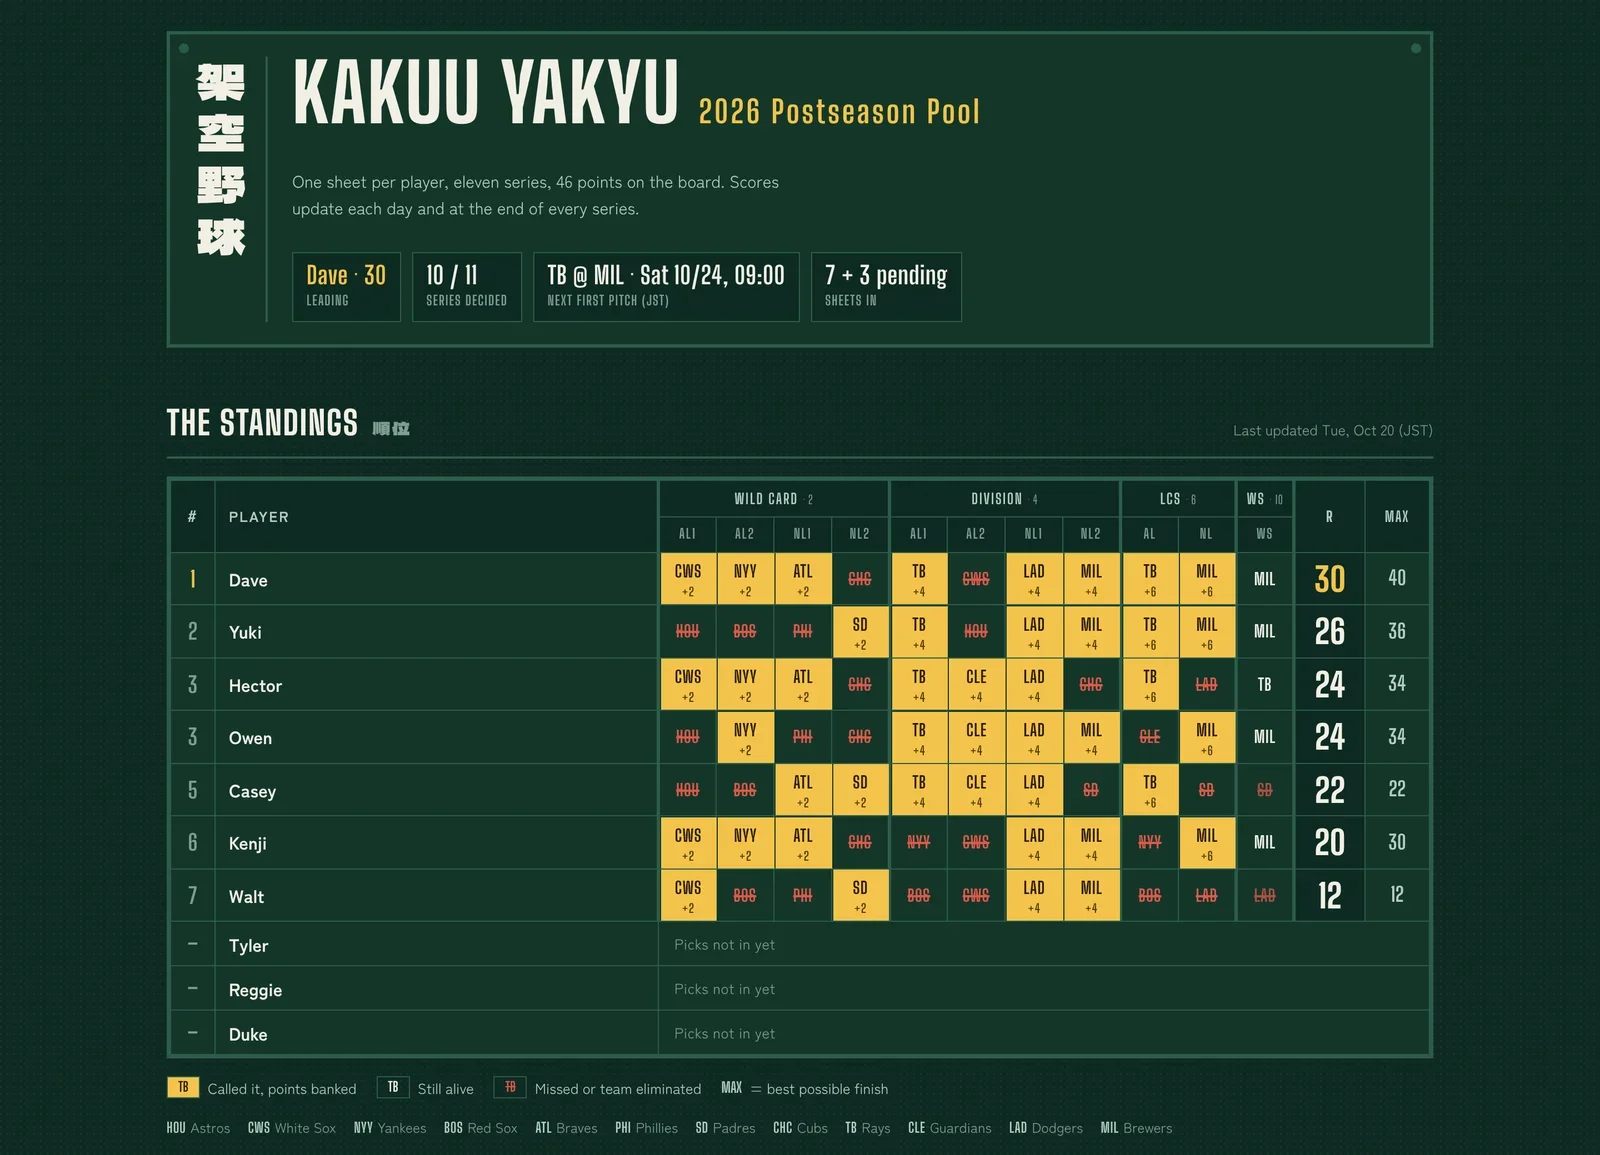
Kakuu Yakyu
Each player picks a winner for every series of the MLB postseason. Results are checked every day; picks are scored, the standings and bracket update, and a short bulletin recaps the day's games.
PERSONAL
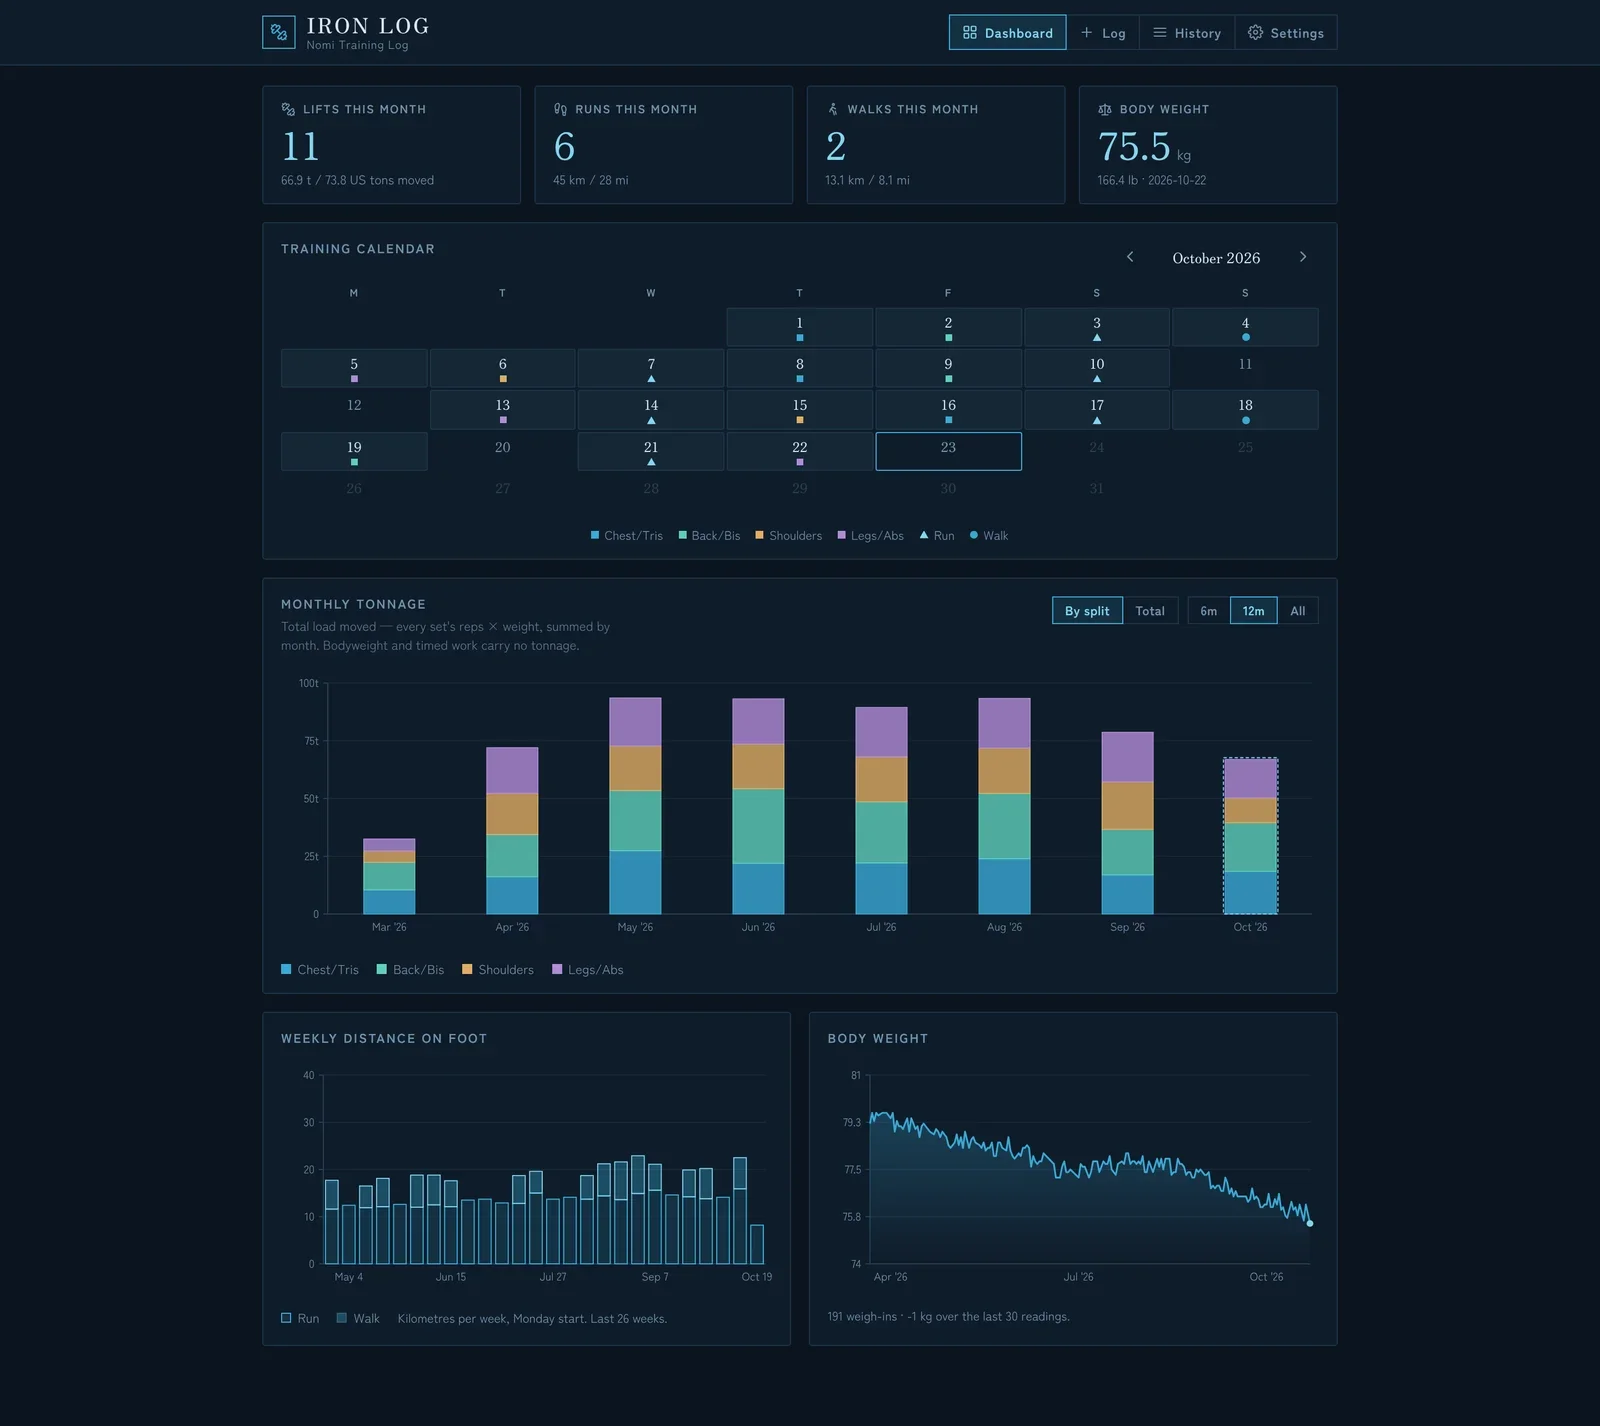
Iron Log
Each workout is logged by split with sets, reps, and weights, alongside runs, walks, and weigh-ins. The dashboard turns that history into a training calendar, monthly lifting volume, weekly distance, and a body weight trend.
Flare Log
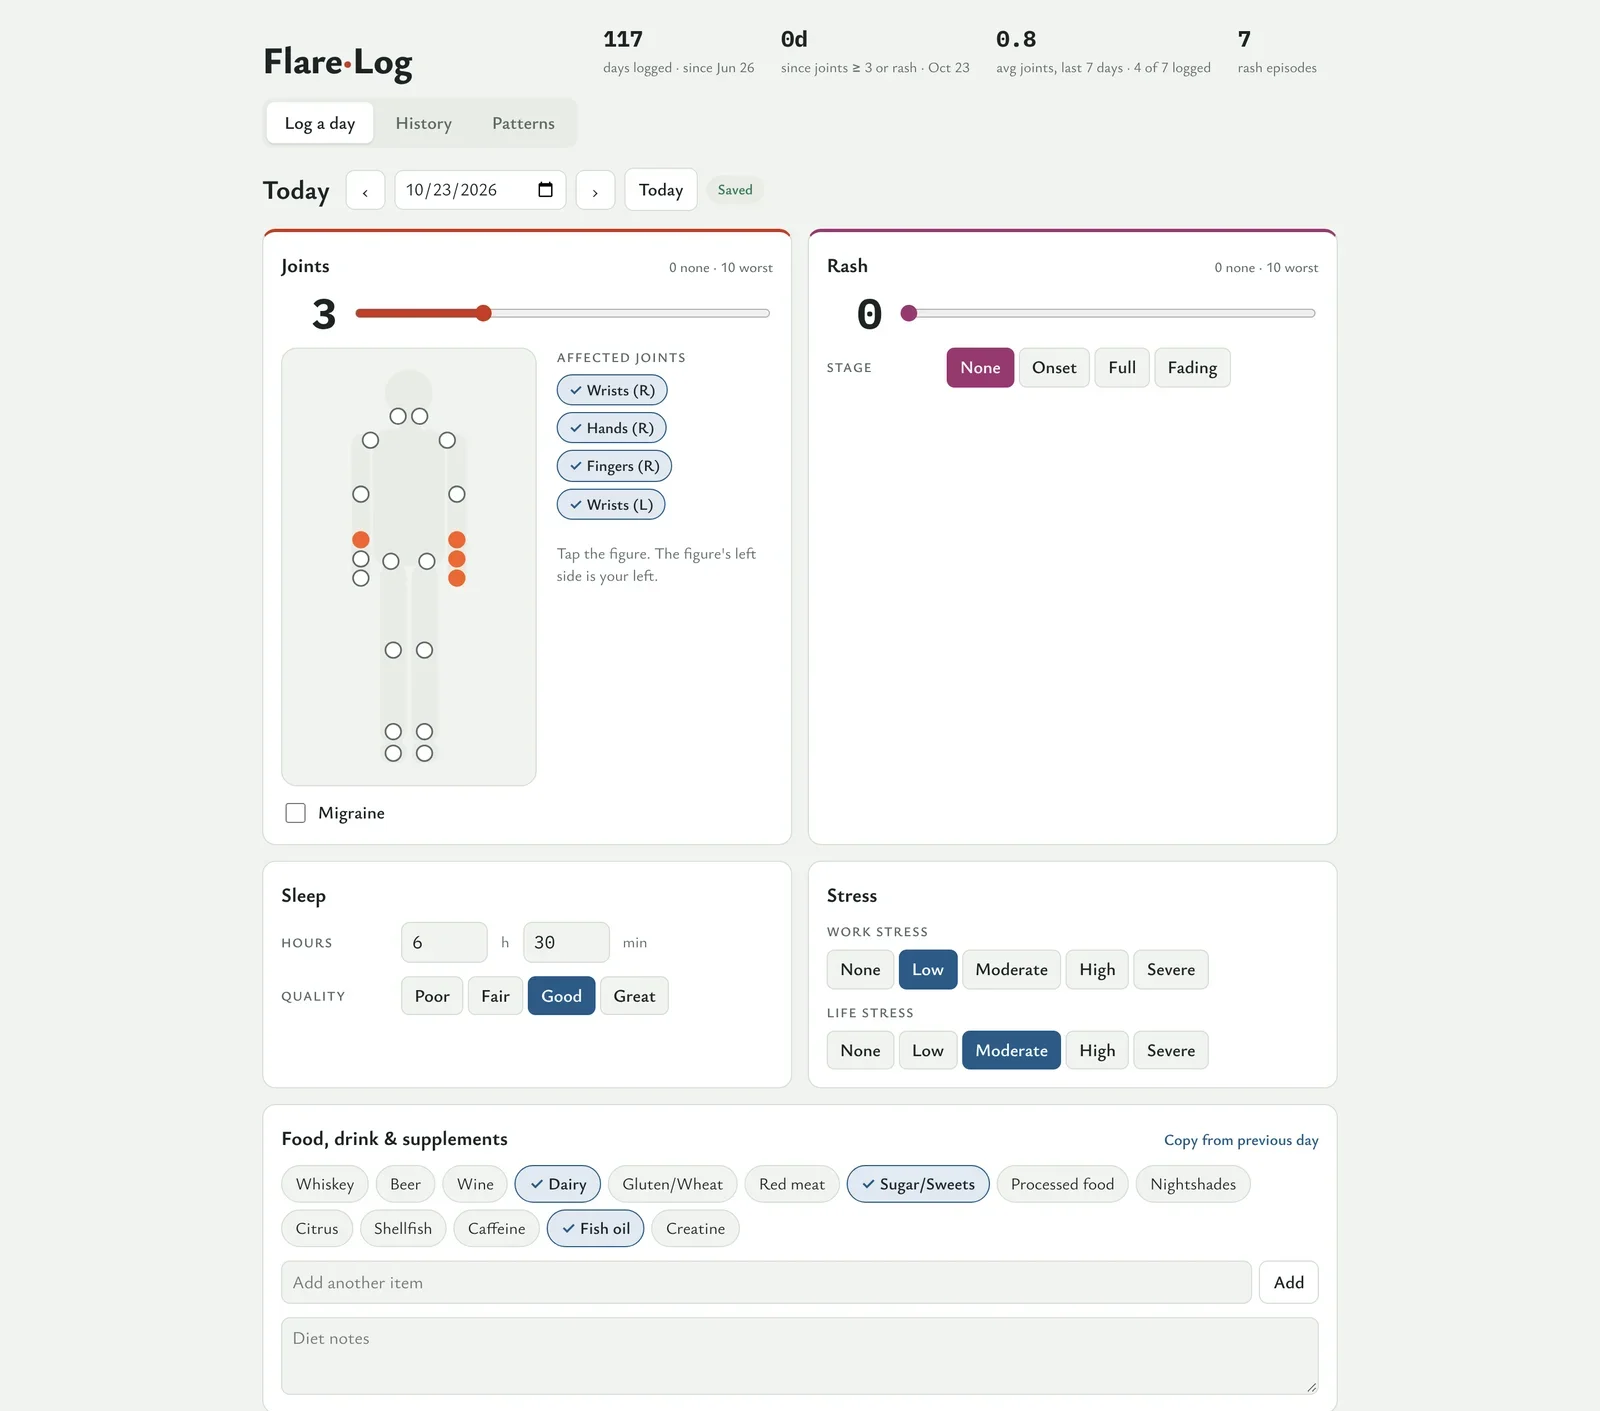
Each day's entry records joint pain on a body map, along with sleep, stress, food, and exercise, and the weather fills in automatically. Over time, the Patterns view compares flare days with calm days to show which factors tend to come with a flare.
Portfolio
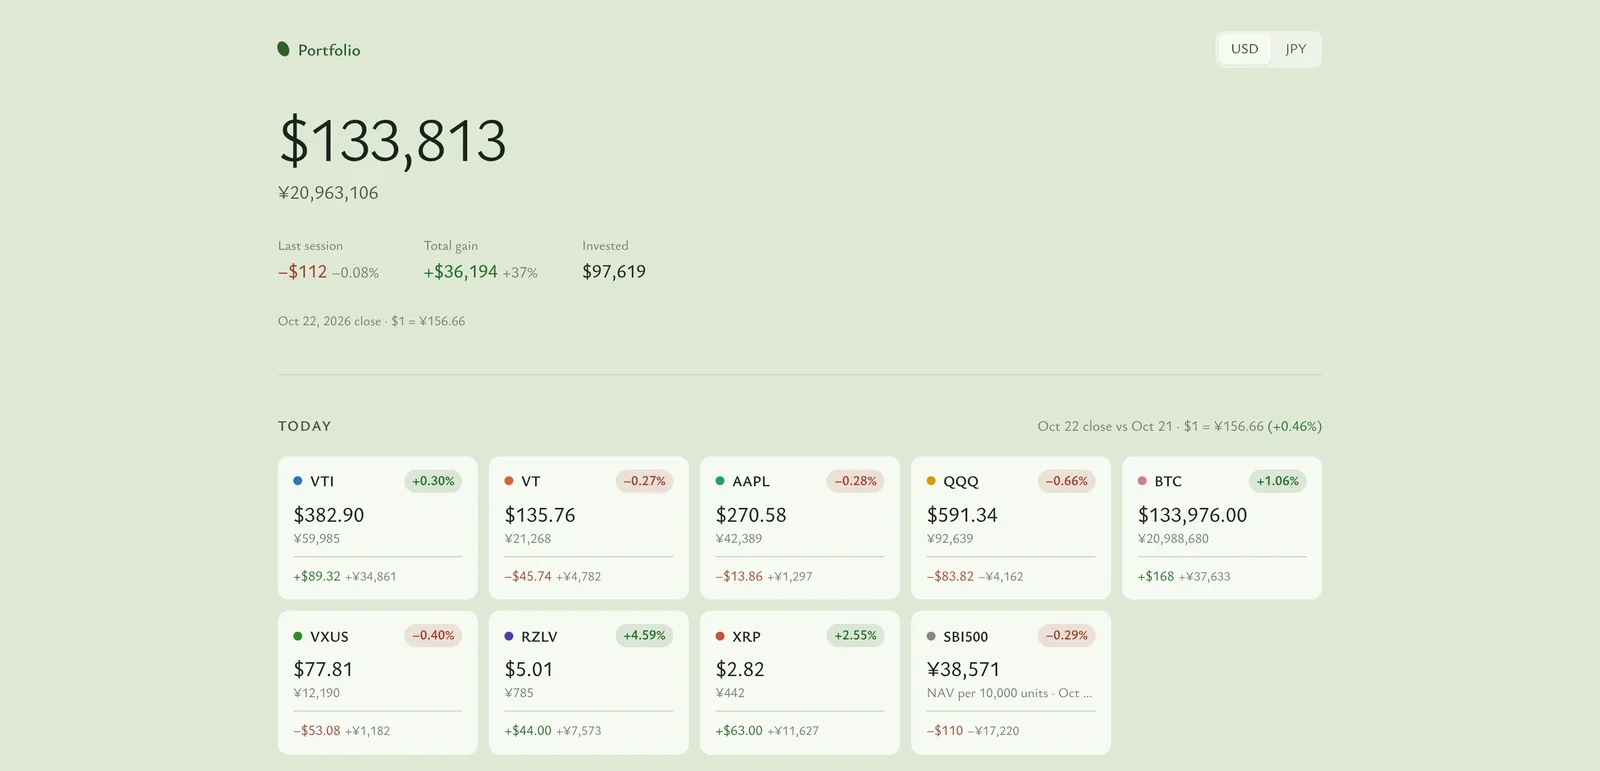
Holdings from several brokerage accounts, crypto, and a Japanese fund are loaded once, and new trades are recorded as they happen. Prices and exchange rates update daily, and the dashboard shows value, performance, upcoming events, and a retirement projection in dollars or yen.
Family Finance
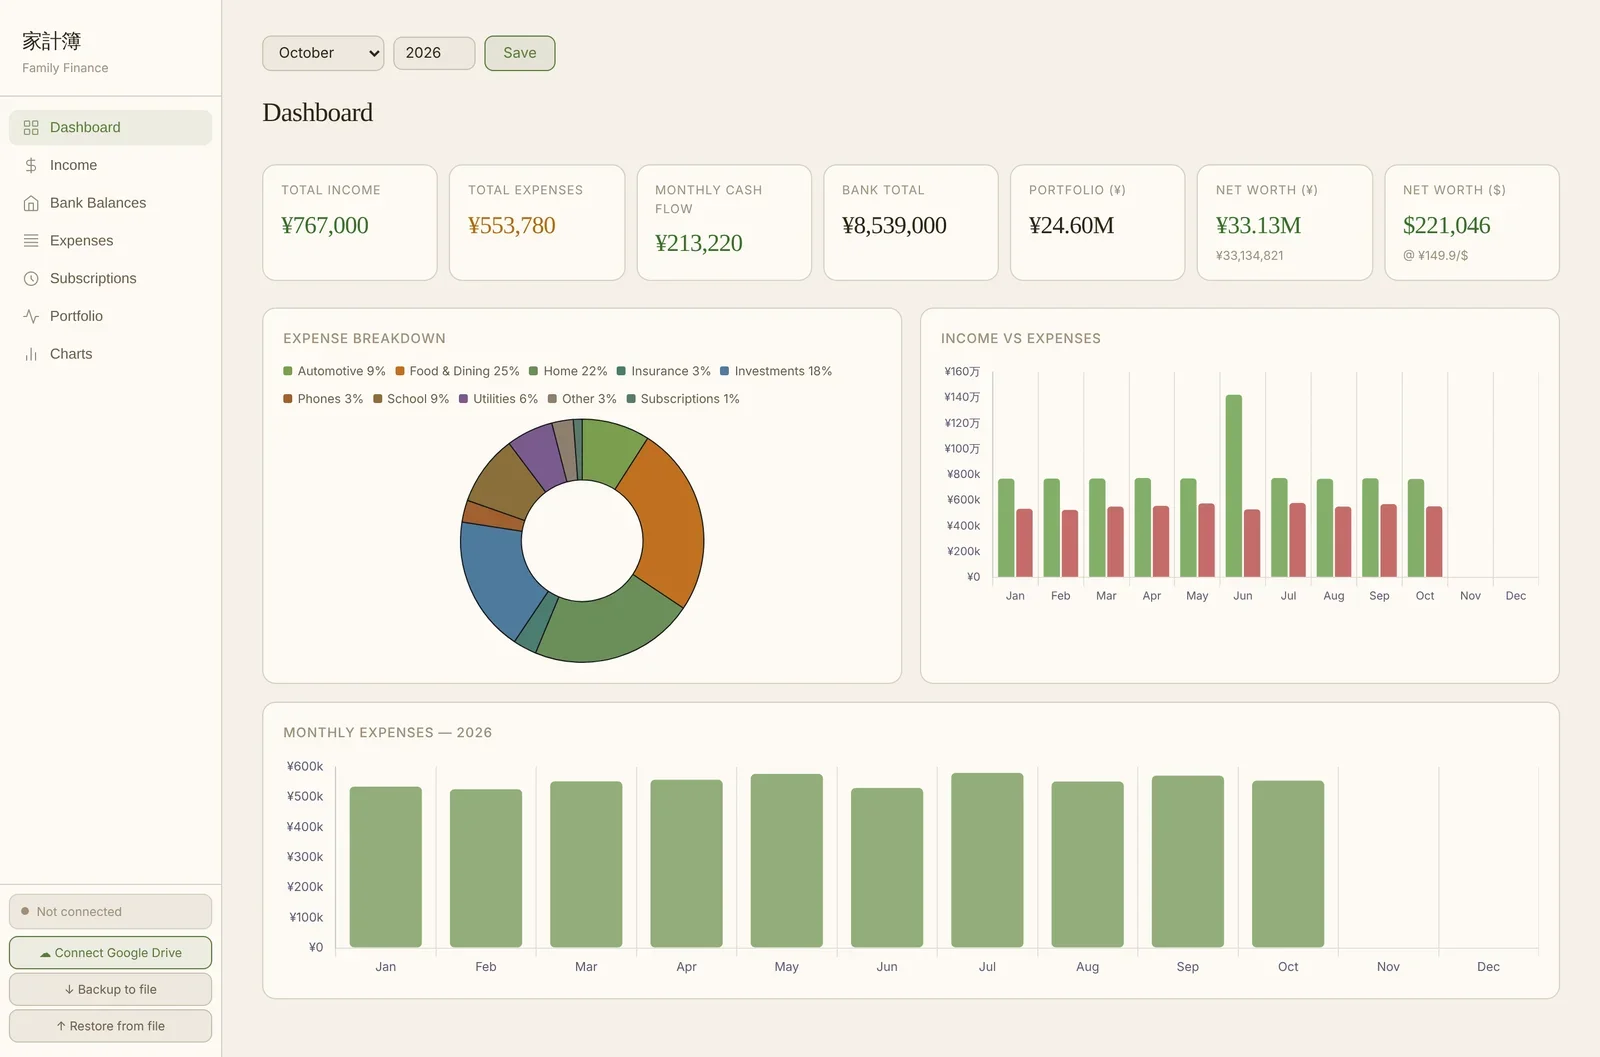
Each month gets its own page of income, bank balances, expenses, and subscriptions, with expenses grouped by category. Bank balances and investments carry over to the next month, while income and spending start fresh. The dashboard and charts show where the money went, how income compares with spending month by month, and how net worth is trending, in yen and dollars.